Date:      Sun, 13 Mar 2011 16:44:30 +0000
From:      Tim Bishop <tim@bishnet.net>
To:        freebsd-fs@freebsd.org
Subject:   Re: ZFS system unresponsive
Message-ID:  <20110313164430.GA977@carrick-users.bishnet.net>
In-Reply-To: <AANLkTinmbYRWz8kG=e1AECpj51cNRvjt2MjjCXixYxjU@mail.gmail.com>
References:  <AANLkTinmbYRWz8kG=e1AECpj51cNRvjt2MjjCXixYxjU@mail.gmail.com>
next in thread | previous in thread | raw e-mail | index | archive | help
On Sun, Feb 27, 2011 at 12:32:17PM +0000, Tim Bishop wrote:
> I have a ZFS system that has become unresponsive. It's running amd64
> 8-STABLE as of approximately 20 Dec. It has a UFS-based root file
> system and then a ZFS mirror for a handful of jails.
>
> It seems to get in to this state occasionally, but eventually can
> unblock itself. This may take hours though.
>
> top -HSj shows the following processes active:
>
> PID JID USERNAME PRI NICE SIZE RES STATE C TIME WCPU COMMAND
> 0 0 root -16 0 0K 1456K zio->i 0 28.9H 7.08% {zio_write_issue}
> 5 0 root -8 - 0K 60K zio->i 0 776:59 0.29% {txg_thread_enter}
>
> A procstat on those processes shows:
>
> 0 100068 kernel zio_write_issue mi_switch sleepq_wait _cv_wait zio_wait dmu_buf_hold_array_by_dnode dmu_read space_map_load metaslab_activate metaslab_alloc zio_dva_allocate zio_execute taskq_run_safe taskqueue_run_locked taskqueue_thread_loop fork_exit fork_trampoline
> 5 100094 zfskern txg_thread_enter mi_switch sleepq_wait _cv_wait txg_thread_wait txg_quiesce_thread fork_exit fork_trampoline
> 5 100095 zfskern txg_thread_enter mi_switch sleepq_wait _cv_wait zio_wait dsl_pool_sync spa_sync txg_sync_thread fork_exit fork_trampoline
>
> (I have the full procstat -k output for those PIDs if needed)
>
> Other processes, such as my hourly zfs snapshots appear to be wedged:
>
> root 7407 0.0 0.0 14672 1352 ?? D 10:00AM 0:00.46 /sbin/zfs snapshot -r pool0@2011-02-27_10.00.01--1d
> root 10184 0.0 0.0 14672 1444 ?? D 11:00AM 0:00.36 /sbin/zfs snapshot -r pool0@2011-02-27_11.00.00--1d
> root 12938 0.0 0.0 14672 1516 ?? D 12:00PM 0:00.11 /sbin/zfs snapshot -r pool0@2011-02-27_12.00.01--1d
>
> PID TID COMM TDNAME KSTACK
> 7407 100563 zfs - mi_switch sleepq_wait _cv_wait txg_wait_synced dsl_sync_task_group_wait dmu_objset_snapshot zfs_ioc_snapshot zfsdev_ioctl devfs_ioctl_f kern_ioctl ioctl syscallenter syscall Xfast_syscall
> 10184 100707 zfs - mi_switch sleepq_wait _cv_wait txg_wait_synced dsl_sync_task_group_wait dmu_objset_snapshot zfs_ioc_snapshot zfsdev_ioctl devfs_ioctl_f kern_ioctl ioctl syscallenter syscall Xfast_syscall
> 12938 100159 zfs - mi_switch sleepq_wait _cv_wait txg_wait_synced dsl_sync_task_group_wait dmu_objset_snapshot zfs_ioc_snapshot zfsdev_ioctl devfs_ioctl_f kern_ioctl ioctl syscallenter syscall Xfast_syscall
>
> zfs-stats output as follows:
>
> ------------------------------------------------------------------------
> ZFS Subsystem Report Sun Feb 27 12:20:20 2011
> ------------------------------------------------------------------------
> System Information:
>
> Kernel Version: 801501 (osreldate)
> Hardware Platform: amd64
> Processor Architecture: amd64
>
> FreeBSD 8.2-PRERELEASE #3: Mon Dec 20 20:54:55 GMT 2010 tdb
> 12:23pm up 68 days, 14:07, 2 users, load averages: 0.35, 0.39, 0.35
> ------------------------------------------------------------------------
> System Memory Statistics:
> Physical Memory: 3061.63M
> Kernel Memory: 1077.46M
> DATA: 99.12% 1067.93M
> TEXT: 0.88% 9.53M
> ------------------------------------------------------------------------
> ZFS pool information:
> Storage pool Version (spa): 15
> Filesystem Version (zpl): 4
> ------------------------------------------------------------------------
> ARC Misc:
> Deleted: 148418216
> Recycle Misses: 51095797
> Mutex Misses: 370820
> Evict Skips: 370820
>
> ARC Size:
> Current Size (arcsize): 55.86% 1087.64M
> Target Size (Adaptive, c): 56.50% 1100.22M
> Min Size (Hard Limit, c_min): 12.50% 243.40M
> Max Size (High Water, c_max): ~8:1 1947.20M
>
> ARC Size Breakdown:
> Recently Used Cache Size (p): 6.25% 68.77M
> Freq. Used Cache Size (c-p): 93.75% 1031.45M
>
> ARC Hash Breakdown:
> Elements Max: 398079
> Elements Current: 38.65% 153870
> Collisions: 230805591
> Chain Max: 34
> Chains: 24344
>
> ARC Eviction Statistics:
> Evicts Total: 4560897494528
> Evicts Eligible for L2: 99.99% 4560573588992
> Evicts Ineligible for L2: 0.01% 323905536
> Evicts Cached to L2: 0
>
> ARC Efficiency:
> Cache Access Total: 1761824967
> Cache Hit Ratio: 84.82% 1494437389
> Cache Miss Ratio: 15.18% 267387578
> Actual Hit Ratio: 84.82% 1494411236
>
> Data Demand Efficiency: 83.35%
>
> CACHE HITS BY CACHE LIST:
> Most Recently Used (mru): 7.86% 117410213
> Most Frequently Used (mfu): 92.14% 1377001023
> MRU Ghost (mru_ghost): 0.63% 9445180
> MFU Ghost (mfu_ghost): 7.99% 119349696
>
> CACHE HITS BY DATA TYPE:
> Demand Data: 35.75% 534254771
> Prefetch Data: 0.00% 0
> Demand Metadata: 64.25% 960153880
> Prefetch Metadata: 0.00% 28738
>
> CACHE MISSES BY DATA TYPE:
> Demand Data: 39.91% 106712177
> Prefetch Data: 0.00% 0
> Demand Metadata: 60.01% 160446249
> Prefetch Metadata: 0.09% 229152
> ------------------------------------------------------------------------
> VDEV Cache Summary:
> Access Total: 155663083
> Hits Ratio: 70.91% 110387854
> Miss Ratio: 29.09% 45275229
> Delegations: 91183
> ------------------------------------------------------------------------
> ZFS Tunable (sysctl):
> kern.maxusers=384
> vfs.zfs.l2c_only_size=0
> vfs.zfs.mfu_ghost_data_lsize=23343104
> vfs.zfs.mfu_ghost_metadata_lsize=302204928
> vfs.zfs.mfu_ghost_size=325548032
> vfs.zfs.mfu_data_lsize=524091904
> vfs.zfs.mfu_metadata_lsize=52224
> vfs.zfs.mfu_size=533595136
> vfs.zfs.mru_ghost_data_lsize=30208
> vfs.zfs.mru_ghost_metadata_lsize=727952896
> vfs.zfs.mru_ghost_size=727983104
> vfs.zfs.mru_data_lsize=100169216
> vfs.zfs.mru_metadata_lsize=0
> vfs.zfs.mru_size=339522048
> vfs.zfs.anon_data_lsize=0
> vfs.zfs.anon_metadata_lsize=0
> vfs.zfs.anon_size=10959360
> vfs.zfs.l2arc_norw=1
> vfs.zfs.l2arc_feed_again=1
> vfs.zfs.l2arc_noprefetch=0
> vfs.zfs.l2arc_feed_min_ms=200
> vfs.zfs.l2arc_feed_secs=1
> vfs.zfs.l2arc_headroom=2
> vfs.zfs.l2arc_write_boost=8388608
> vfs.zfs.l2arc_write_max=8388608
> vfs.zfs.arc_meta_limit=510447616
> vfs.zfs.arc_meta_used=513363680
> vfs.zfs.mdcomp_disable=0
> vfs.zfs.arc_min=255223808
> vfs.zfs.arc_max=2041790464
> vfs.zfs.zfetch.array_rd_sz=1048576
> vfs.zfs.zfetch.block_cap=256
> vfs.zfs.zfetch.min_sec_reap=2
> vfs.zfs.zfetch.max_streams=8
> vfs.zfs.prefetch_disable=1
> vfs.zfs.check_hostid=1
> vfs.zfs.recover=0
> vfs.zfs.txg.write_limit_override=0
> vfs.zfs.txg.synctime=5
> vfs.zfs.txg.timeout=30
> vfs.zfs.scrub_limit=10
> vfs.zfs.vdev.cache.bshift=16
> vfs.zfs.vdev.cache.size=10485760
> vfs.zfs.vdev.cache.max=16384
> vfs.zfs.vdev.aggregation_limit=131072
> vfs.zfs.vdev.ramp_rate=2
> vfs.zfs.vdev.time_shift=6
> vfs.zfs.vdev.min_pending=4
> vfs.zfs.vdev.max_pending=10
> vfs.zfs.cache_flush_disable=0
> vfs.zfs.zil_disable=0
> vfs.zfs.zio.use_uma=0
> vfs.zfs.version.zpl=4
> vfs.zfs.version.spa=15
> vfs.zfs.version.dmu_backup_stream=1
> vfs.zfs.version.dmu_backup_header=2
> vfs.zfs.version.acl=1
> vfs.zfs.debug=0
> vfs.zfs.super_owner=0
> vm.kmem_size=3115532288
> vm.kmem_size_scale=1
> vm.kmem_size_min=0
> vm.kmem_size_max=329853485875
> ------------------------------------------------------------------------
>
> I hope somebody can give me some pointers on where to go with this.
>
> I'm just about to reboot (when it unwedges) and upgrade to the latest
> 8-STABLE to see if that helps.
I did the upgrade to 8-STABLE and it didn't help. I'm still seeing the
same issue.
Someone else in another thread mentioned about graphing the zfs-stats
output with munin, so I thought I'd give that a whirl. Here are the
results:
(static snapshot of data so it doesn't change between when I write this
and when somebody reads it)
http://www.bishnet.net/tim/tmp/munin/carrick/carrick/index.html
This slow down is triggered by the tarsnap backups I run each day. They
start about 01:15 (in the same timezone as the graphs) and finished at
around 11:15 after I poked it. It slows down when processing my Maildir
folders, but doesn't actually stop - it's processing a single file every
couple of seconds.
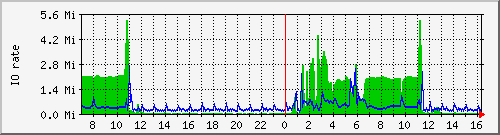
Here's a graph showing the disk I/O:
http://www.bishnet.net/tim/tmp/statgrab/disk.ad4.read_bytes-day.png
That flat period from about 06:30 until 11:00 is where it appears to get
stuck. Disk I/O stays constant as can be seen in the graph. Killing the
tarsnap process unjams it which lets it going on to backing up the next
tree of files (I run a handful of tarsnap processes one after another).
The zpool iostat looks something like this during that period:
capacity operations bandwidth
pool used avail read write read write
---------- ----- ----- ----- ----- ----- -----
pool0 111G 23.2G 248 114 865K 269K
mirror 111G 23.2G 248 114 865K 269K
ad4s3 - - 43 56 2.47M 269K
ad6s3 - - 39 56 2.41M 269K
---------- ----- ----- ----- ----- ----- -----
So it's showing more I/O on the vdevs than on the actual pool.
This tied up with my previous findings that the ZFS kernel processes are
using a lot of CPU time suggests to me that ZFS is doing stuff
internally which is slowing down all external operations on the
filesystem.
In particular, I find this graph quite interesting:
http://www.bishnet.net/tim/tmp/munin/carrick/carrick/zfs_arc_utilization.html
The ARC usage is jumping around all over the place while the backups are
running.
Thanks for taking the time to read this, and I appreciate any input.
Tim.
--
Tim Bishop
http://www.bishnet.net/tim/
PGP Key: 0x5AE7D984
Want to link to this message? Use this URL: <https://mail-archive.FreeBSD.org/cgi/mid.cgi?20110313164430.GA977>